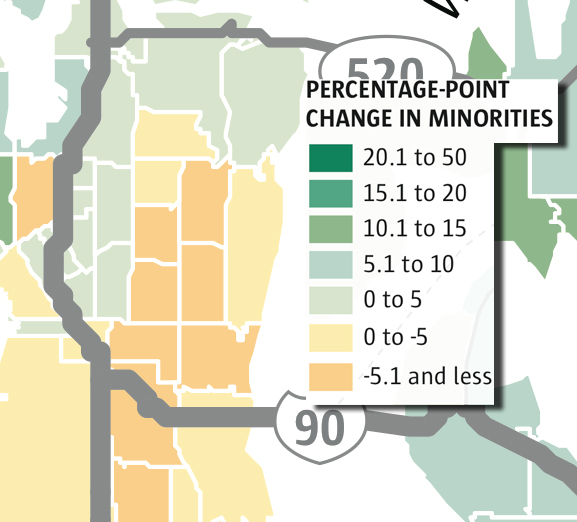
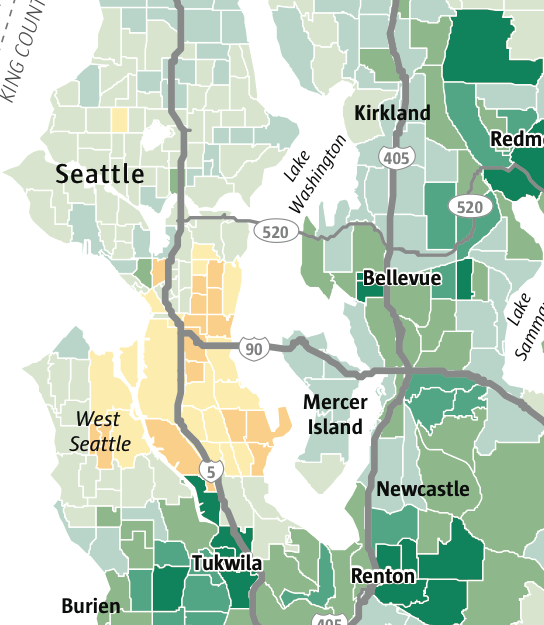
 Mark Nowlin / The Seattle Times. Used with permission. View their map online.
Newly released Census data reveals just how much whiter the Central District has become since 2000. The percentage of minority residents has gone up in most of the region and much of Seattle, according to a map of the new data created by the Seattle Times. But nearly the entire Central District has became whiter, with minority populations in some areas declining as much as 17 percent since the 2000 Census.
Total population in the neighborhood has grown. Nearly every census block showed an increase in residents except for the census area north of 23rd and Jackson, which showed a decline of three people. The growth in minority populations in Seattle as a whole (13.4 percent) outpaced total growth (8 percent) by over five percent since 2000. The city’s population is now 608,660.
While many of the Central District neighborhoods are becoming more white, not all of the changes are due to minority populations leaving. Much of the new white residents are in new housing. For example, in the census block covering much of the Jackson Place neighborhood, minority residents made up nearly 87 percent of the population in 2000. In 2010, that number dropped over 17 percent to 69 percent, one of the most dramatic changes in the city. However, during the same time period, total population of the census block grew 37 percent, also among the highest in the city.
Other parts of the neighborhood have also experienced dramatic changes. By the Seattle Times’ definition of the Central Area, which does not include any areas south of Yesler, the Central Area is now more than half white (58 percent) for the first time in over 60 years.
 Mark Nowlin / The Seattle Times. Used with permission. View their .
Looking at the data from a more regional view, the city and county appear to be mixing. Areas that were heavily white are becoming more diverse, while areas with heavier minority populations are becoming more white. In King County, the white population actually declined by 24,000 while minority populations grew by 218,000.
However, as always, population data does not tell the whole story. Looking at maps in terms white and non-white populations does not account for the special place the Central District holds as the center of much of Seattle’s black history. Japanese internment during WWII resulted in vacant housing, and segregation and racist housing rules in other areas of the city caused the neighborhood to become heavily black last century. The neighborhood has been the center of the Civil Rights movement in Seattle.
This is only the tip of the iceberg in terms of Census data. As more data is released, we will continue crunching the numbers to help paint a more clear picture of how the neighborhood is changing.
We encourage you to play around with the map created by Seattle Times. If you are even more ambitious, you can dive into the raw data from Census.gov. Find something interesting? Share your thoughts and findings below.

I love census data but am having a little trouble accessing the interactive map. Also when you say the census block north of 23rd and S. Jackson I am not sure which area you mean. If it was one that included Garfield High School and Promenade, I would not be surprised. That would the be block that included the Northeast corner. Otherwise I would be a little surprised since the west side of 23rd has a lot of housing where no one lived before. Then again I am having trouble seeing the census blocks.
“Total population in the neighborhood has grown. Nearly every census block showed an increase in residents except for the census area north of 23rd and Jackson, which showed a decline of three people. The growth in minority populations in Seattle as a whole (13.4 percent) outpaced total growth (8 percent) by over five percent since 2000. The city’s population is now 608,660.
Yeah, it’s a little hard to tell where all the streets are on the map. I think once we have block-by-block data, it will be even easier to get a feel for what areas lost population, etc.
If I find a more accurate tool for mapping the data, I will definitely post about it.