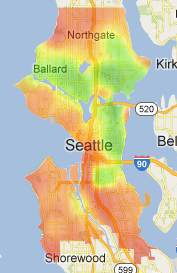
Where bike commuters live, according to BikeScore
As you sit at Cal Anderson Park watching people on bikes stream down E Pine Street while two teams of bike polo players do battle in the former tennis court, you might think Capitol Hill is something of a hub for bicycling in the city.
But as a percentage of the population, residents in the Central District are more likely to commute to work by bike than on Capitol Hill, and the CD has one of the highest rates of bike commuting south of the Ship Canal.
The Seattle Times published an interactive map recently displaying bike-to-work rates according to neighborhood. The Central District comes in at 4.37 percent*, barely higher than North Beacon Hill, but far lower than the 9.46 percent in the North University District area (the highest in the city). Only South Lake Union and Eastlake had higher bike commute rates among neighborhoods south of the Ship Canal.
For more detail, I posted a map last spring on Seattle Bike Blog showing BikeScore’s bike commuter map (see attached). While the Times map attempts to organize the data by neighborhood segment, the BikeScore map hows more of a block-by-block heat map of cycling popularity. And the CD is covered in green.
This map comes as the city and neighborhood are figuring out whether bike facilities should be added as part of the upcoming 23rd Ave repaving and complete streets project.
Interestingly, distance from downtown seems to play a double-sided role in bike commute rates: The neighborhoods furthest away from downtown are also the least-bikey. But neighborhoods in downtown, where everywhere is easily reachable by walking or transit, also had very low bike commute rates. The CD seems to be right in that sweet spot where workplaces are a bit too far for an easy walk, but well within an easy bike ride.
Clearly, there are many more factors at play than just distance from downtown. Far out neighborhoods like North Aurora and the south end of Rainier Valley also have poor bicycle facilities, and neighborhoods are divided and boxed by very busy streets that discourage bicycling.
I went deeper into analyzing the map over at Seattle Bike Blog.
*One caveat: The figures used in these maps comes from the Census’ American Communities Survey, which has several flaws. For one, people are asked via a phone survey to tell surveyors which mode they used most for commuting in the past week. If you combine biking and transit, but most of your trip’s distance was on transit, then you would not count as a bike commuter. If you only bike to work some days, you would also not count. And, of course, the data in no way considers all the other trips people make on bike (to the grocery store, the park, a friend’s house, out to eat, etc). So it is safe to assume that these numbers are a low-end estimate of cycling rates.

I fall into that common CD commuter description pretty well. It takes less than 20 minutes for me to bike into town vs. 40 minutes to bus. Though I have a typical route, I find that biking across the CD can be pretty much like walking. It’s very easy to simply jog over a block or two if need be- all streets go through!
I think that 23rd is currently the worst arterial in the CD for biking. I go into fight-or-flight mode on that street.
Pingback: Neighborhood News: Naming Baby Lions and Losing Street Cred | canacast.networks.beta