
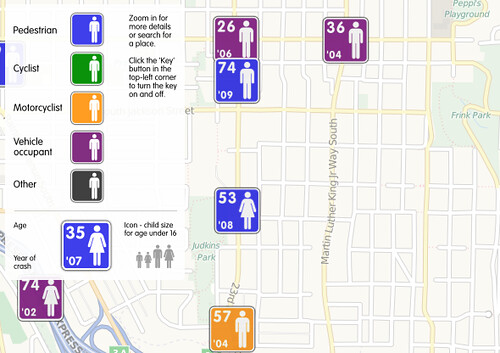
ITO World has created a map marking the spot of every road fatality in the country between 2001 and 2009 (h/t Seattle Transit Blog).
Zooming down to the CD, 23rd Ave stands out as the most dangerous non-freeway in the neighborhood, especially between Yesler and I-90. Four people died on this stretch in eight years, including one person on a motorcycle, one in a car and two on foot.
MLK also saw three deaths, all of them in motor vehicles. As reported in our sister site Capitol Hill Seattle, Madison, especially as it heads up to First Hill just north of Seattle U campus, also saw several deaths in the eight years included in the map: two people in cars, one person on a motorcycle and one person walking.
The victims are marked by whether they were in a car, on a motorcycle, on a bike or walking. Each victim square also notes the victim’s age, gender and year of death.
As with our analysis of people who died in recent years while walking, the CD seems to have a disproportionate number of traffic deaths. Capitol Hill, which has more population density, saw fewer deaths than the CD. While traffic fatalities do not tell the whole story of road safety (as many as ten times the number who die get seriously injured), the difference is stark.
And the likelihood that someone is killed it is not entirely about how busy a street is. According to city data, Broadway carries about 23,000 vehicles per day and had one death (where it meets Madison), while the most dangerous stretch of 23rd Ave carries only about 13,500 vehicles per day and saw four deaths. As we have argued in the past, 23rd is in desperate need of a redesign. The current four-lane highway design encourages speeding and makes it difficult and dangerous to cross the street on foot, and the traffic volumes are not enough to need so many lanes. The current design is unnecessarily dangerous for people no matter how they get around.
The city recently wrapped up a series of Road Safety Summit forums and is currently working to put the information gathered together and come up with some next steps. The final meeting will be 6 p.m December 12 at City Hall.
Here’s the interactive map from ITO. If you notice anything interesting, point it out in the comments below.
Fantastic article, and incorporation of this amazing map. This was very helpful. Thank you!
Excellent info indeed. Wouldn’t mind seeing 23rd down to 2 lanes, plus bike lanes, and appropriate turn and bus pull-outs. Probably would be faster and safer.
Man – look at all those green and blue bodies in Seattle vs purple beyond. A big green pile of bicyclist bodies. Now that is going green all the way.
Don’t believe this for a minute.
This is just propaganda to justify another road diet.
23rd doesn’t need a road diet.
12th didn’t need one either and that has been a disaster.
It takes 3 times longer to get from end to end now that it had a diet.
MLK had 3 vehicle deaths in 8 years and it is two lanes with a turning lane. MLK needs better enforcement and some traffic calming measures – the next meeting of SDOT’s Neighborhood Traffic Calming Program: Traffic Safety is in our neighborhood! The webpage says Wednesday, January 17th, 2012 at 6;30pm at Douglas Truth Library-2300 E Yesler Way. But the 17th is a Tuesday, I’ll try to find out which day is correct and respost. http://www.seattle.gov/transportation/ntcp_safetymeeting.htm
Does anybody know what year the MLK changes were put in place? Just did a quick search and couldn’t find an answer.