
I was digging around in census data the other day, and in the process got drawn into the stats for our neighborhood. (Note that due to census boundaries, this is an expansive definition of the CD, including Madison Valley, Miller Park, Jackson Place, Judkins Park, and a chunk of Leschi.)
Here’s the stats as of this summer:
Our total population: 26,346 people
We’re very diverse: (city-wide stats in parenthesis)
- 43% White (67%)
- 32% African American (8%)
- 10% Asian (14%)
- 8% Hispanic (5%)
- 5% Other (5%)
- 1% Native American (1%)
The median household income of the neighborhood is $52,500 per year, a bit lower than the state-wide median of $60,010 and the city-wide median of $62,195.
Our income has risen since 2000, going up 27% over that time.
The highest earners live in Madison Valley, and the lowest in Squire Park.
I’m curious about how you found census updates before 2010. The school district, for instance seems to be mainly stuck using the 2000 census data until 2010. I know that I have occasionally heard others cite birth rates for certain years in specific areas. I probably should ask the public library but am a bit lazy, especially if I can get the answer here.
Your report is extremely interesting because the City of Seattle Datasheet
http://www.seattle.gov/oir/datasheet/Datasheet2008.pdf
has median family income at $81,403 in the region. This is the base number that is being used when one hears about ‘80%’ of median as ‘Workforce’.
Seattle Department of Housing establishes the following based on Family Size:
Percent of Median Income
Family Size 30% 40% 50% 60% 65% HUD 80%
1 Person $17,100 $22,800 $28,500 $34,200 $37,050 $43,050
2 Persons $19,500 $26,040 $32,550 $39,060 $42,315 $49,200
3 Persons $21,950 $29,320 $36,650 $43,980 $47,645 $55,350
4 Persons $24,400 $32,560 $40,700 $48,840 $52,910 $61,500
5 Persons $26,350 $35,160 $43,950 $52,740 $57,135 $66,400
6 Persons $28,300 $37,760 $47,200 $56,640 $61,360 $71,350
7 Persons $30,250 $40,360 $50,450 $60,540 $65,585 $76,250
8 Persons $32,200 $42,960 $53,700 $64,440 $69,810 $81,200
Source: http://www.seattle.gov/housing/development/2008_Income_and_R
For a perspective on jobs an incomes in the region:
http://zipcon.net/~jvf4119/workforceresearch.htm
Seems like some things just do not jibe….
Thank you.
This is good but I don’t see the stats by area of the city or neighborhood, whatever.
Thanks for the links. City-wide data seems tough to find. The link you include for median income is the “metro-area”, including the east-side that pushes it up substantially.
I got the city-wide median from:
http://www.realestate.com/WA/Seattle/Seattle-Area-Info-Incom
But it looks like that’s old, so I’ve updated it to match that in Wikipedia: http://quickfacts.census.gov/qfd/states/53/5363000.html.
I got the overall demographic data for Seattle from:
http://quickfacts.census.gov/qfd/states/53/5363000.html
The detailed stats on the neighborhood came straight from the Census bureau:
http://www.ffiec.gov/Geocode/CensusDemo.aspx
They do estimates on a yearly basis. The neighborhood numbers came from here: http://www.ffiec.gov/Geocode/CensusDemo.aspx
http://www.ffiec.gov/Geocode/CensusDemo.aspx
I admit I am coming at it sideways. I am just making the point that when the City talks about “Workforce” Tax Abatement Programs or ‘Workforce’ Incentive Zoning, they are talking about 80% of $80,000, which has NO relevance to the workforce in Seattle or the CD. It doesn’t even hit the AVERAGE of incomes in the metro area.
It’s just a caution because if I hear 80% of median and I am thinking median is $52K or even $62K, then I would think about those proposals very differently. Makes me think who does the city want to encourage to move into the CD and who does the city want to encourage to move ‘somewhere’ else. And, then I guess commute to do all the jobs that need doing.
The Bureau of Labor Statistics. Speaking as and old statistical analyst…it provides a pretty great look at the characteristics of the population…
http://www.bls.gov/ but you have to sign up as a researcher now. Makes me yearn for the ‘old’ days when those ftp sites were freely available!
Sorry – that site has some usability issues and a very frustrating non-persistent url structure. Try this link:
http://www.ffiec.gov/Geocode/default.aspx
Put in the address for the area you’re looking for, and it will bring up the stats for the matching census tract.
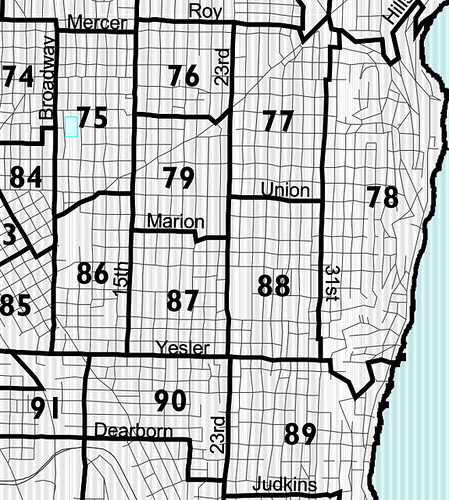
I used 7 of them to get stats across the entire neighborhood (address to find it in parenthesis):
87 (700 22nd Ave 98122)
88 (700 26th Ave 98122)
77 (1400 26th Ave 98122)
79 (1400 26th Ave 98122)
86 (700 14th Ave 98122)
89 (700 24th Ave S 98144)
90 (500 20th Ave S 98144)
I’ve also attached a copy of the census map as an image above.
Thank you. I figured out to use it by just tract also. The data is from 2000, right? No updates will be available until 2010, right? Interesting. In some areas where things changed the census can be misleading. The number of residents or school age children residing in an area is one example.
The next census should be interesting. Hopefully redistricting will leave the area less divided between political entities such as two county council and legislative districts. This make advocacy and holding politicians accountable more difficult.
http://www.ffiec.gov/Geocode/default.aspx
If on the FFIEC site, you go to Census Data instead of geofinder, there is both spreadsheets for all census tracts in the MSA and an information sheet. Population numbers are from the 2000 census and 2008 income numbers are estimates…
Also, you cannot get a Median Income (estimated or not) for the combined census tracts based on the data provided. Unlike AVERAGE, which can be multiplied by the number of families for each tract, then summed and divded by the sum of families — MEDIAN is half are above and half are below. You need the raw numbers. All one can do is report tract by tract.
There is CD report for 2000 at:
http://www.seattle.gov/dpd/Research/Population_Demographics/#single
Given that the Estimated 2008 Median Family income is somewhere between 127.27 % and 127.29 % of 2000 Median Family Income in every census tract in the Seattle-Bellevue-Everett MSA on the FFIEC site, I’d calculate from the City CD report just noted that the estimated Median Family Income in the CD is $51,774 so you were close. Can’t say that HH and non-family incomes are estimated to rise at the same rate, but if the rate were the same, we’d be looking at 2008 est. HH Income of 45,905, non-family of 40,666, and per capita of 31,610.
All of which is way below HUD area median income of 80K, and even way below 80% of that.
First, as a part-time demographer, I’m thrilled to see Scott’s analysis and the interest it has generated. I *heart* the numbers and am glad to see others do too!
Part of the median income puzzles discussed above may be due to the fact that there are two different units of analysis, household versus family.
Households are persons who live in one location; families are groups of two or more related by blood, marriage or adoption. You can have a household of one or a household of two or more unrelated persons (often roommates). Single persons living alone are included in household income statistics, but not in family income statistics. Since – on average – one person earns less than two, this means that household income is almost always lower than family income. The dynamics of family formation also mean that people in families are often higher earners because parents and married persons tend to be a little older than non-parents and non-married persons. Older people also on average earn more.
A related issue is whether families and households in the CD are comparable in size and composition to other parts of the city. If we have more single-person households and/or more single-parent families, that would make our household and family income look lower even if the individuals involved had the same levels of earnings.
Don’t understand how you could get a median for the area based on medians for each census tract. Also, 2008 numbers are estimated and hte population numbers are from the 2000 census.