
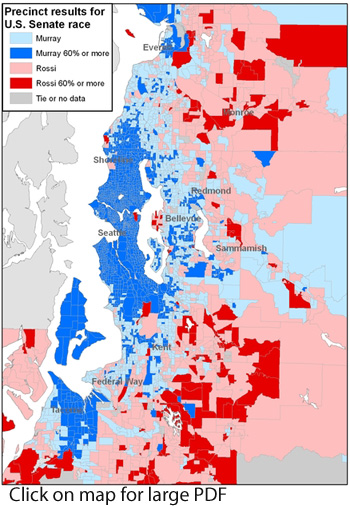
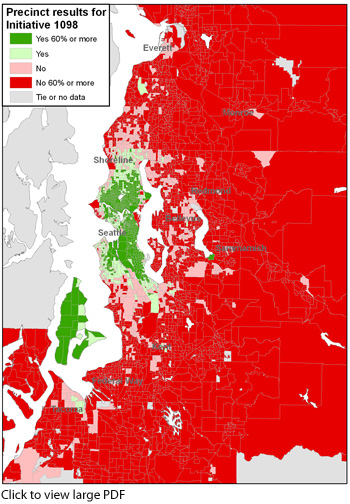
Our news partners at the Seattle Times have compiled maps that show the voting precinct breakdowns for three major statewide races decided this fall. There aren’t any huge surprises for the Central District but it is interesting to note where the pockets of support were strongest for the two initiatives in the mix — liquor privatization initiative 1100 and income tax initiative 1098. More telling is the sea of eastern opposition to 1098 which was defeated — and for Dino Rossi in the senate race. Rossi, of course, was also a loser. Is also a loser? Anyway. Here are the maps shared here by permission of the Times.
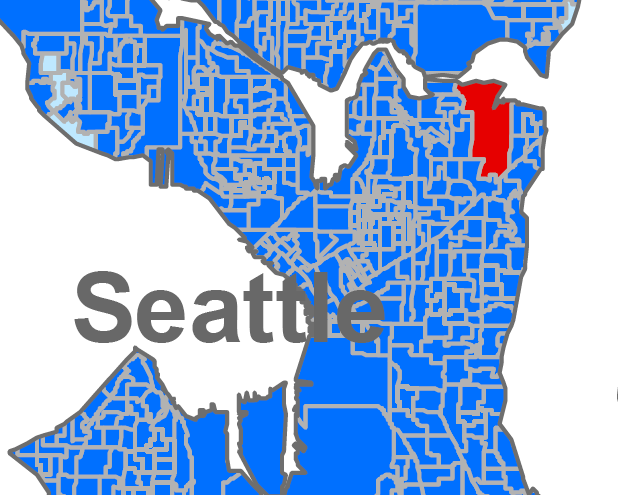
SENATE: Murray (52.36%)
Seattle Times analysis
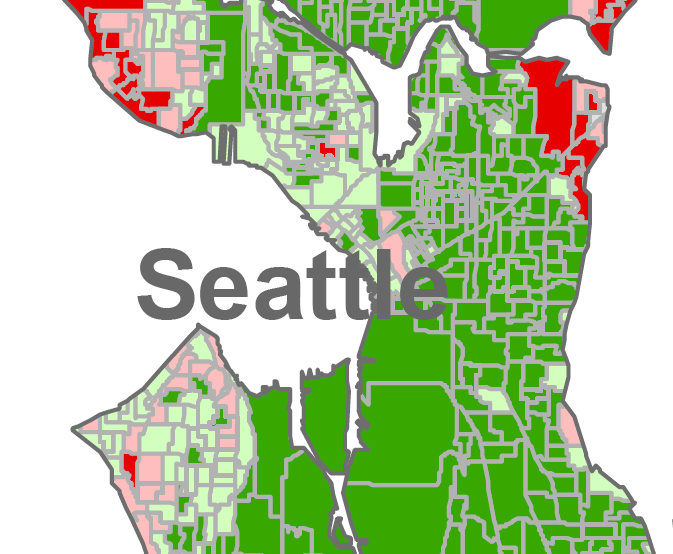
INITIATIVE 1098 — income tax (No, 64.15%)
Seattle Times analysis
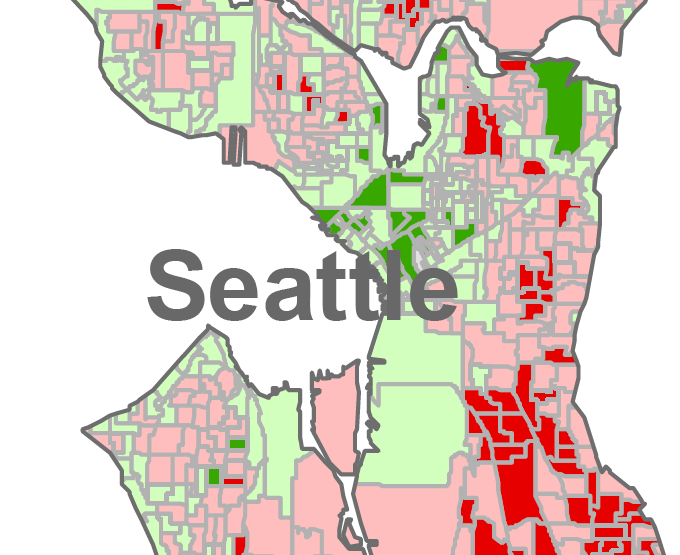
INITIATIVE 1100 — liquor privatization (No, 53.43%)
Seattle Times Analysis
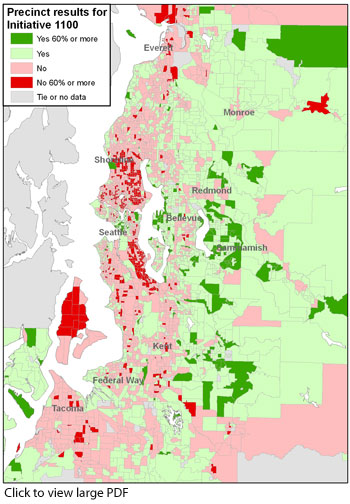
Surprising to see so much of the city(outside of the downtown core) against 1100, and the rural/suburban areas in support. Oh well, here’s to hoping a single initiative(damn you 1105) does better in a presidential year(with more young people possibly voting it should).
go on, get out of here, secede already!
It’s not as surprising as you may think. In order to understand the geographic distribution of the vote, you have to understand the geographic distribution of the VOTERS. You’ve seen this in national maps that show how much of the country is red states, although the most populous areas are blue. As with the rest of the country, the most sparsely populated areas of the county (with the largest precincts) are the most conservative.
my opinion is when folk vote red its because they are either ignorant and poor or selfish Richy Rich types.
very enlightened thinking chris.
and my opinion is that you are a moron for thinking like that Chris.
that one bright red box in a sea of blue is pretty funny. :)
remember the siege of Sarajevo and other serbo-croation cities in that civil war? The countryside was already segregated between moslum and christian, serb and croat; the cities were integrated places of tolerance and liberal thinking. When the warlords took over they attacked the cities to create the divided and fearful population they needed to hold on to power. Spend some time in rural WA and you can get a sense of how people like Dino are able to mount three failed campaigns and Tim Eyeman keep putting up new initiatives.
yeah! +1 for blue tolerance and inclusiveness!
This red spot has existed for decades, the one and only. In the distant past there are a few funny stats on candidates (most did not win) who did get votes out of the area. Probably it is good that I don’t have the exact numbers at my fingertips.
It’s cute that blue (in general) shout and scream ‘tolerance and inclusiveness’, yet more often that not, quickly shut any thought down about a true red having the right to believe and live they choose. Maddy Park and Broadmoor always take a beating on this blog, yet they were are supposed to be inclusive and tolerated right? Right.
PB, I wasn’t trying to be exclusive or intolerant, I was just commenting on the humor of it.
That anyone would vote for an income tax is terrifying.
I am saddened by the these maps, but depressed that 1098 looks like this.
60% of Seattle took Olympia at face value? So much for smartest US city.
I am Pro Patty Murray and don’t really care about liquor sales.
‘terrifying’? I’m not surprised the measure failed, but there are plenty of things that I think truly are terrifying. A state income tax in Washington is not one of those things.